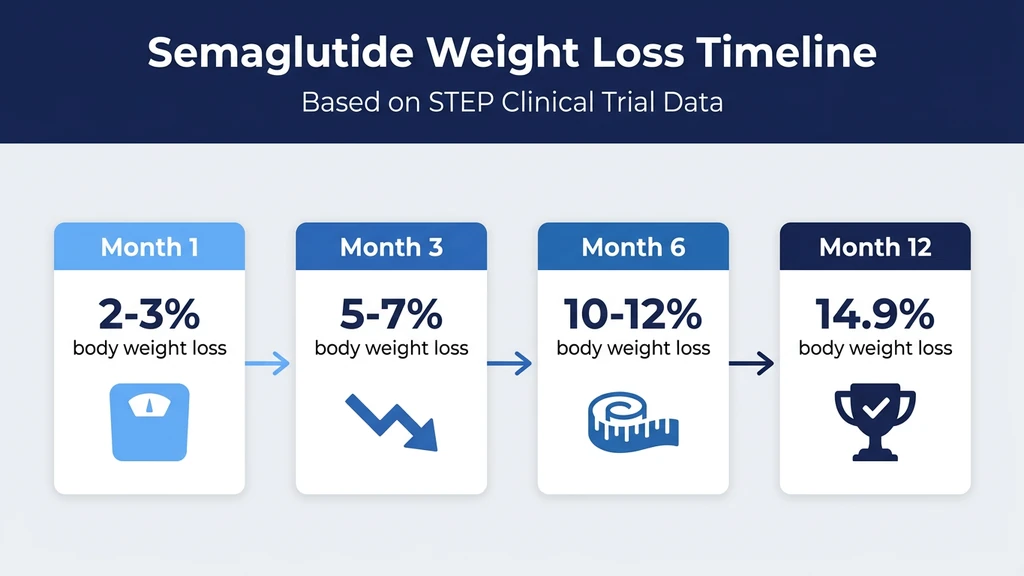
You have been scrolling through semaglutide before-and-after photos for the past hour. Some show dramatic 80-pound losses. Others show modest changes after six months. You cannot tell which results are typical and which are outliers. The STEP 1 clinical trial, the largest semaglutide weight loss study, documented an average of 14.9% body weight loss at 68 weeks on the 2.4 mg dose (Wilding et al., 2021). That translates to roughly 33 pounds for someone starting at 220 lbs.
But averages hide the range. In that same trial, 32% of participants lost over 20% of their body weight, while 14% lost less than 5%. Your results will depend on dose, duration, diet, exercise, and metabolic starting point. This article replaces anecdotal before-and-after photos with clinical trial data at every time point, so you can set expectations grounded in evidence rather than social media highlights.
| Timeframe | Average Weight Loss | Dose Phase (Wegovy) | What Changes |
|---|---|---|---|
| Month 1 | 2-3% (~4-7 lbs) | 0.25 mg | Appetite drops, portions shrink |
| Month 2 | 4-5% (~9-11 lbs) | 0.5 mg | Clothes begin to loosen |
| Month 3 | 6-8% (~13-18 lbs) | 1.0 mg | Visible face and waist changes |
| Month 6 | 10-12% (~22-26 lbs) | 2.4 mg | Significant body recomposition |
| Month 12 | 13-15% (~29-33 lbs) | 2.4 mg | Near-maximum weight loss |
| Month 16 | 14.9% (~33 lbs) | 2.4 mg | STEP 1 trial endpoint |
For a detailed breakdown of the dose-escalation schedule that drives these timelines, see our semaglutide dosage chart. To understand when the drug begins suppressing appetite, read how long semaglutide takes to work.
Get your custom peptide protocol:
- Tailored to your body and goals
- Precise dosing and cycle length
- Safe stacking combinations
- Backed by peer-reviewed studies
- Ready in under 2 minutes
Month 1: The Starting Line (0.25 mg Dose Phase)
The first month on semaglutide delivers subtle internal shifts rather than visible external changes. You are on the lowest dose, 0.25 mg weekly, which is one-tenth of the full Wegovy dose. This phase exists for GI adaptation, not dramatic weight loss.
What the Data Shows at 4 Weeks
The STEP 1 trial recorded approximately 2 to 3% body weight loss during the first four weeks (Wilding et al., 2021). For a 220 lb starting weight, that is 4 to 7 pounds. For a 180 lb person, 4 to 5 pounds. Some participants lost nothing in month one. Others lost 8 pounds. Both outcomes fall within the normal range.
Most of this early loss comes from reduced caloric intake rather than metabolic changes. Semaglutide activates GLP-1 receptors in the hypothalamus within 24 to 72 hours, dampening hunger signals. You eat less because food becomes less mentally compelling. The technical term is reduced "food noise," the background mental chatter about snacks, meals, and cravings.
At this dose, the drug's blood concentration has not yet reached steady state. It takes 4 to 5 weeks of consistent weekly dosing at any given dose level to achieve stable drug levels. Month one is pharmacological setup, not the main event.
What You Feel vs. What Others See
You feel the changes before anyone else notices. Appetite suppression is the earliest measurable effect. A study on food cravings during semaglutide treatment found 15 to 25% reductions in craving intensity for sweet and high-fat foods within the first four weeks (Blundell et al., 2022). Portions shrink naturally. A plate that used to disappear now leaves leftovers.
Externally, month one produces no visible transformation. Four to seven pounds of weight loss distributed across an entire body is undetectable to coworkers and friends. If you are tracking waist circumference, you may see a half-inch reduction, but that falls within daily measurement variation.
The most common side effect during month one is nausea, affecting roughly 44% of trial participants. It typically peaks 2 to 3 days after injection and fades by day 5. Eating smaller, low-fat meals reduces severity. For most people, nausea diminishes as the body adapts to GLP-1 stimulation.
Month 2: First Measurable Changes (0.5 mg Dose Phase)
The dose doubles to 0.5 mg at week 5. This increase pushes blood levels closer to the therapeutic range and produces the first weight loss that feels real rather than statistical.
What the Data Shows at 8 Weeks
By week 8, STEP 1 participants had lost approximately 5% of starting body weight (Wilding et al., 2021). Five percent is the threshold that the FDA considers clinically meaningful for weight loss medications. For a 220 lb person, that is 11 pounds. For a 250 lb person, 12.5 pounds.
Gastric emptying slows measurably at 0.5 mg. Food stays in the stomach longer, extending the feeling of fullness after each meal. This delayed emptying is a core mechanism of semaglutide's weight loss effect. It also explains why heavy, greasy meals become uncomfortable at this dose; the stomach simply cannot process them at the previous speed.
Blood sugar improvements appear clearly by week 8, even in people without diabetes. Fasting insulin levels drop as the body requires less insulin to manage smaller meals. This early metabolic shift predicts long-term success. People who achieve 5% or more weight loss by week 8 tend to reach the highest total losses at 68 weeks.
The First Visible Before-and-After Differences
Month two is when the mirror starts reflecting the scale. Facial puffiness, driven by water retention and subcutaneous fat, begins to resolve. Jawlines become slightly more defined. Midsections lose their tightest tension against waistbands. These are small changes, but they are the first ones that register visually.
A useful tracking method at this stage is progress photos. Take front and side images every four weeks under the same lighting conditions. The cumulative comparison from week one to week eight reveals changes that daily mirror checks miss. Our peptide safety guide covers recommended monitoring protocols for the first three months.
If you are not seeing progress at the 8-week mark, the most common explanations are liquid calories bypassing appetite suppression, eating through reduced hunger out of habit, or a concurrent medication promoting weight gain. Our guide on not losing weight on semaglutide covers these scenarios in detail.
Month 3: The Inflection Point (1.0 mg Dose Phase)
Month three is where before-and-after comparisons start telling a compelling story. The dose reaches 1.0 mg at week 9, entering the range that produced meaningful results in the SUSTAIN and STEP clinical trial programs.
What the Data Shows at 12 Weeks
By week 12, average weight loss in the STEP 1 trial reached 8 to 10% of starting body weight. For someone who started at 220 lbs, that is 18 to 22 pounds. At this level of loss, metabolic biomarkers shift measurably. The STEP 2 trial, which studied semaglutide in people with type 2 diabetes, documented HbA1c reductions of 1.0 to 1.5 percentage points by week 12 (Davies et al., 2021).
Triglycerides fall by 12 to 20%. Blood pressure drops by 2 to 4 mmHg systolic. Liver enzymes (ALT) improve in people with non-alcoholic fatty liver disease. These internal before-and-after changes do not show in photos, but they represent genuine risk reduction for cardiovascular disease, type 2 diabetes, and liver disease.
The 1.0 mg dose also marks the point where the SUSTAIN trials (Ozempic for diabetes) measured most of their glycemic benefit. HbA1c reductions of 1.5 to 1.8 percentage points were documented at this dose level (Ahren et al., 2017).
Body Composition Changes Become Visible
The 18 to 22 pound range is where other people start noticing. Faces thin. Necks narrow. Abdominal profiles flatten. Side-by-side photos taken at baseline and week 12 show clear differences in facial contour, upper arm size, and waistline definition.
Semaglutide preferentially targets visceral fat, the metabolically active fat surrounding organs. A sub-study of the STEP 1 trial using DEXA scans found that approximately 40% of total weight lost was visceral fat, a disproportionately high share given that visceral fat typically represents only 10 to 20% of total body fat (Wilding et al., 2021). This explains why waist circumference changes outpace overall weight loss at this stage.
Two side effects become relevant during month three. Fatigue may appear as the caloric deficit accumulates. Eating 500 to 800 fewer calories daily for 12 weeks depletes glycogen stores and reduces resting metabolic rate. Adequate protein intake, at least 0.7 g per pound of lean body mass, offsets muscle loss and limits fatigue.
Hair thinning can also begin at this stage. Telogen effluvium, a temporary shedding triggered by rapid weight loss, peaks 2 to 4 months after significant caloric restriction begins. The hair loss is caused by the metabolic stress of weight loss, not by the semaglutide molecule itself. It resolves within 6 to 12 months as the body adapts to its new weight.
Month 6: Significant Transformation (2.4 mg Full Dose)
By month six, the dose escalation is complete. You have been on the full 2.4 mg Wegovy dose for approximately 8 to 10 weeks, and steady-state blood levels have been reached. This is when the full pharmacological effect is operating.
What the Data Shows at 24 Weeks
At 24 weeks, STEP 1 participants on semaglutide 2.4 mg had lost approximately 10 to 12% of starting body weight (Wilding et al., 2021). For a 220 lb person, that is 22 to 26 pounds. For someone who started at 280 lbs, 28 to 34 pounds.
The STEP 3 trial, which combined semaglutide with intensive behavioral therapy including structured exercise, showed even better results at this timeframe: approximately 13% weight loss at 24 weeks (Wadden et al., 2021). The additional 1 to 3 percentage points from behavioral intervention demonstrate that semaglutide and lifestyle changes produce additive benefits.
By month six, the rate of weight loss begins to decelerate. This is not a plateau or drug failure. It is the body approaching a new equilibrium. As weight drops, caloric expenditure decreases. The reduced appetite from semaglutide creates a fixed caloric deficit. When expenditure falls to match the new, lower intake, weight loss slows. The drug is still working; the math has simply rebalanced.
The Six-Month Before-and-After Comparison
Six months is the standard clinical benchmark for weight loss interventions. Before-and-after photos at this interval show transformations that are unmistakable. Twenty-two to thirty-four pounds of weight loss changes body shape, not just body size.
Waist circumference decreases by 3 to 5 inches on average. Clothing sizes drop by 1 to 3 sizes depending on starting point. Face shape changes substantially, with more defined cheekbones and jawline. Many users report that people they have not seen in several months do not immediately recognize them.
The SELECT cardiovascular outcomes trial, which enrolled 17,604 adults with established heart disease, measured a 20% reduction in major adverse cardiovascular events (heart attack, stroke, cardiovascular death) with semaglutide 2.4 mg (Lincoff et al., 2023). These cardiovascular benefits appeared to emerge between months 4 and 6 of treatment. The before-and-after difference is not only visible in the mirror; it is measurable in arterial health.
For those who began semaglutide and are now considering whether tirzepatide might deliver better results, the six-month mark is a reasonable decision point. Our switching guide covers how to transition safely between the two medications.
Month 12: Approaching Maximum Results
The period from month 6 to month 12 is where the weight loss curve flattens into a gradual slope. The dramatic monthly drops of the first half-year give way to smaller, steadier losses. Before-and-after photos separated by this interval show refinement rather than transformation.
What the Data Shows at 52 Weeks
At 52 weeks (one year), STEP 1 participants had lost approximately 13 to 14% of starting body weight. The weight loss curve from month 6 to month 12 adds roughly 2 to 3 additional percentage points beyond the 6-month result. For a 220 lb person, that translates to an additional 4 to 7 pounds beyond the 6-month total.
The STEP 5 trial, which extended treatment to 104 weeks (2 years), confirmed that weight loss at 52 weeks was close to the maximum. Participants lost 15.2% of body weight at 104 weeks, only slightly more than the 68-week result (Garvey et al., 2022). The drug continues working, but the body has largely equilibrated to the new caloric balance.

Body composition analysis from extended trials reveals an important nuance. Between months 6 and 12, even when the scale slows, visceral fat continues to decrease. Lean mass stabilizes if protein intake is adequate. The before-and-after difference during this period is more about body composition than body weight.
Metabolic Before-and-After at One Year
The most significant before-and-after comparisons at 12 months are metabolic, not visual. Bloodwork drawn at baseline and at one year tells a story of cardiovascular and metabolic risk reduction.
Average improvements documented across the STEP program at 52 to 68 weeks include: systolic blood pressure down 3 to 6 mmHg, fasting glucose down 10 to 15 mg/dL, HbA1c reduced by 0.5 to 1.0 percentage points in non-diabetic individuals, triglycerides reduced by 15 to 25%, CRP (inflammation marker) reduced by 30 to 40%, and waist circumference reduced by 5 to 7 inches.
These improvements persist as long as the medication continues. They begin to reverse within months of stopping. The STEP 1 extension study found that participants who discontinued semaglutide at 68 weeks regained two-thirds of the weight they had lost within the following year. This underscores that semaglutide manages obesity rather than curing it.
For tracking your own metabolic changes, our peptide dosage chart covers recommended blood panel timing. Learn more about the drug's pharmacokinetics in our guide on how long semaglutide stays in your system.
Month 16 and Beyond: The Trial Endpoint and Long-Term Maintenance
The STEP 1 trial endpoint at 68 weeks (approximately 16 months) represents the most cited semaglutide before-and-after data point. This is the number that appears in FDA labeling, marketing materials, and most clinical discussions.
The Full STEP 1 Distribution at 68 Weeks
Understanding the full distribution of results prevents the most common expectation error. Social media highlights the best responders. Clinical trials show everyone.
| Weight Loss Category | Semaglutide 2.4 mg (%) | Placebo (%) |
|---|---|---|
| Lost 5% or more | 86.4% | 31.5% |
| Lost 10% or more | 69.1% | 12.0% |
| Lost 15% or more | 50.5% | 4.9% |
| Lost 20% or more | 32.0% | 1.7% |
Source: Wilding et al., 2021
The table reveals two critical points. First, semaglutide works for the vast majority: 86% of participants lost at least 5%, the clinically meaningful threshold. Second, the dramatic before-and-after transformations (20%+ loss) apply to roughly one in three users, not the majority. Half of participants lost less than 15%. One in seven did not reach even the 5% threshold.
Your individual result depends on factors covered later in this article: starting weight, metabolic status, medication adherence, diet quality, and physical activity. The trial population followed the full 68-week protocol with monthly check-ins and dietary guidance, conditions that many real-world users do not replicate.
Two-Year Data: Does Weight Loss Continue?
The STEP 5 trial answered whether extending treatment beyond 68 weeks produces additional weight loss. At 104 weeks (2 years), participants on semaglutide 2.4 mg had lost 15.2% of body weight, nearly identical to the 68-week result (Garvey et al., 2022). The extra 36 weeks of treatment did not produce meaningful additional loss, but it prevented regain.
This finding shapes realistic expectations. Semaglutide reaches its maximum weight loss effect between months 12 and 16. Continued treatment beyond that point maintains results rather than extending them. The before-and-after comparison at 2 years looks very similar to the comparison at 16 months.
The maintenance phase raises cost and logistics questions. At roughly $1,000 to $1,600 per month for brand-name Wegovy, 2 years of treatment costs $24,000 to $38,000. Use our peptide cost calculator to estimate your actual monthly expense, including compounded formulations that may significantly reduce cost. For proper storage during long-term treatment, see does semaglutide need to be refrigerated and does semaglutide expire.
What Happens After Stopping: The Reverse Before-and-After
No discussion of semaglutide before-and-after is complete without addressing what happens when treatment ends. The data here is less encouraging than the weight loss data but equally important for setting expectations.
The STEP 1 trial extension followed participants for one year after semaglutide was discontinued at week 68. On average, participants regained two-thirds of the weight they had lost. Those who had lost 15% regained approximately 10 percentage points, ending at roughly 5% below their original weight (Wilding et al., 2022).
Appetite returns within 2 to 3 weeks of the last injection. Semaglutide has a half-life of approximately 7 days, meaning drug levels drop by half each week after stopping. By week 5 post-discontinuation, blood levels are negligible. The hypothalamic appetite circuits that semaglutide was suppressing resume their baseline signaling, and hunger returns to pre-treatment levels.
This pattern is consistent with obesity being a chronic condition managed by medication, similar to hypertension managed by blood pressure drugs. Stopping the medication allows the underlying condition to reassert itself. Our guide on how long semaglutide stays in your system covers the pharmacokinetic timeline of drug clearance in detail.
The implication for before-and-after expectations is significant. The "after" in semaglutide treatment is not a permanent state unless treatment continues or the individual makes sustained lifestyle changes that independently maintain the caloric deficit. People who maintain exercise habits and dietary changes developed during treatment retain more weight loss than those who relied solely on the drug's appetite suppression.
Factors That Determine Where You Fall in the Results Range
The 68-week STEP 1 results ranged from less than 5% weight loss to over 30%. The following factors explain most of the variance between individuals and determine whether your before-and-after comparison will resemble the average, the super-responders, or the modest-responders.
Starting Weight and Body Composition
Higher starting weights produce larger absolute weight losses but similar percentages. A 300 lb person losing 15% drops 45 pounds. A 180 lb person losing 15% drops 27 pounds. The visual before-and-after impact may actually be greater for the lighter person, because 27 pounds on a smaller frame produces more visible change per pound lost.
Individuals with higher body fat percentages also tend to respond well because semaglutide preferentially targets adipose tissue. People who are already relatively lean (BMI 27 to 30) lose less total weight but may experience greater improvements in body composition and waist-to-hip ratio.
Insulin Resistance and Diabetes Status
Insulin resistance slows weight loss on semaglutide. The STEP 2 trial, which enrolled people with type 2 diabetes, documented 9.6% average weight loss at 68 weeks, compared to 14.9% in the non-diabetic STEP 1 population (Davies et al., 2021). That is a 35% reduction in weight loss efficacy attributable to insulin resistance alone.
The mechanism is straightforward. Insulin resistance impairs the body's ability to mobilize stored fat for energy. Even with reduced caloric intake, the metabolic machinery for fat oxidation operates less efficiently. Semaglutide still works in this population, but before-and-after results take longer to accumulate and plateau at a lower total loss.
Blood sugar and HbA1c improvements, however, appear earlier and more dramatically in diabetic users. A before-and-after comparison of metabolic markers may be more meaningful than weight for this population.
Diet Quality and Protein Prioritization
Semaglutide controls how much you eat. It does not control what you eat. Two people on identical semaglutide doses can have vastly different before-and-after results depending on their food choices.
Protein intake is the single most important dietary variable. Consuming 0.7 to 1.0 g of protein per pound of lean body mass preserves muscle during weight loss. Muscle preservation maintains metabolic rate, which sustains the caloric deficit that drives continued weight loss. Low-protein dieters lose more muscle, experience greater metabolic slowing, and plateau earlier.
The STEP 3 trial incorporated dietary counseling alongside semaglutide. Participants who received this guidance lost 16.0% of body weight, compared to 14.9% in STEP 1 without formal dietary support (Wadden et al., 2021). Dietary optimization adds roughly 1 to 2 percentage points of additional weight loss. For strategies on optimizing your results, see not losing weight on semaglutide.
Exercise and Resistance Training
Exercise produces a modest but consistent improvement in semaglutide before-and-after results. Aerobic exercise (walking, cycling, swimming) increases the caloric deficit beyond what appetite suppression alone achieves. Resistance training preserves lean mass, preventing the metabolic slowdown that limits long-term results.
The combination matters more than either alone. A person on semaglutide who walks 30 minutes daily and performs resistance training twice weekly will produce better before-and-after results at 6 and 12 months than someone relying solely on the medication. The STEP 3 trial's intensive behavioral therapy arm, which included exercise prescription, supports this conclusion.
For those interested in the best peptides for weight loss, combining semaglutide with regular exercise creates a synergy that no single compound matches. Our getting started with peptides guide covers foundational principles for building an evidence-based protocol.
Medication Adherence and Dose Consistency
Real-world adherence to semaglutide is substantially lower than clinical trial adherence. Pharmacy claims data shows that average persistence on GLP-1 receptor agonists is only 6 to 9 months. Trial participants, who had monthly check-ins and research coordinator support, maintained treatment for the full 68 weeks.
Missed doses reduce the drug's accumulated effect. Semaglutide requires 4 to 5 weeks at each dose level to reach steady-state blood concentrations. Missed weeks reset this accumulation partially. Two consecutive missed doses can drop blood levels below the therapeutic threshold, temporarily eliminating appetite suppression.
Consistent weekly injection on the same day, at the same time, is the simplest controllable factor that separates strong before-and-after results from disappointing ones. For proper reconstitution and dosing of compounded semaglutide, see our guide on how much bacteriostatic water for semaglutide and the unit conversion reference.
Setting Realistic Before-and-After Expectations
Social media before-and-after photos are curated. They show the best angle, the best lighting, and often the best responders. Clinical trial data shows the unfiltered distribution. Here is how to calibrate your expectations using the evidence.
The Minimum Meaningful Result
A 5% reduction in body weight is the FDA's threshold for clinical significance. At this level, measurable improvements appear in blood sugar, blood pressure, triglycerides, and liver fat. The before-and-after difference on the scale is modest: 11 pounds for a 220 lb person. Visually, 5% may not be dramatic. Metabolically, it reduces type 2 diabetes risk by 58% in pre-diabetic individuals.
In the STEP 1 trial, 86.4% of semaglutide participants achieved at least 5% weight loss. If your goal is health improvement rather than dramatic visual transformation, the probability of success is high. Even the side effects during treatment, covered in our guide on how long semaglutide side effects last, are a worthwhile trade for this level of metabolic benefit in most cases.
The Average Result
The average semaglutide before-and-after at 68 weeks is 14.9% weight loss: 33 pounds for a 220 lb person. This level of loss changes clothing sizes by 2 to 3 sizes. Faces become noticeably leaner. Waist circumference drops 5 to 7 inches. Friends and coworkers comment consistently.
Half of participants do better than 14.9%. Half do worse. If you match the average, your before-and-after comparison will show clear, significant, meaningful change. It will not match the dramatic 80-pound transformations that dominate social media. Expecting the average rather than the extreme prevents discouragement and premature discontinuation.
The Super-Responder Result
Approximately 32% of STEP 1 participants lost 20% or more of their body weight: 44+ pounds for a 220 lb person. These are the before-and-after photos that go viral. At this level of loss, body shape transforms fundamentally. Clothing from the "before" period becomes unwearable. Health markers normalize across the board.
There is no reliable way to predict whether you will be a super-responder before starting treatment. Early response is the best predictor: people who lose 5% or more by week 8 are more likely to reach the 20%+ tier. Genetic variation in GLP-1 receptor density, gut hormone signaling, and central appetite regulation likely explains much of the variance.
For those seeking even greater weight loss, tirzepatide produced 20.2% average weight loss in the SURMOUNT-5 head-to-head trial against semaglutide's 13.7% at 72 weeks. The next-generation triple agonists currently in trials may push averages higher still. See how long tirzepatide takes to work for a comparison timeline.
Semaglutide Before and After: Beyond Weight
Weight is the most photographed before-and-after metric, but semaglutide changes multiple physiological systems. A complete before-and-after assessment includes markers that do not appear in mirror selfies.
Cardiovascular Before and After
The SELECT trial, enrolling 17,604 adults with established cardiovascular disease, documented a 20% reduction in major adverse cardiovascular events with semaglutide 2.4 mg over a median follow-up of 40 months (Lincoff et al., 2023). This is the single most important before-and-after finding in the semaglutide clinical program.
Systolic blood pressure drops 3 to 6 mmHg. Resting heart rate decreases slightly. CRP, a marker of systemic inflammation linked to cardiovascular risk, falls by 30 to 40%. These changes are measurable on routine blood panels and represent genuine disease risk reduction. A blood pressure reading of 142/88 before treatment dropping to 136/82 after six months may not photograph well, but it represents a meaningful reduction in stroke and heart attack risk.
Liver Health Before and After
Non-alcoholic fatty liver disease (NAFLD) affects roughly 25% of adults with obesity. Semaglutide trials have consistently shown improvements in liver fat content and liver enzyme levels. ALT, a marker of liver inflammation, typically normalizes within 6 to 12 months of treatment.
A phase 2 trial of semaglutide specifically for non-alcoholic steatohepatitis (NASH), the inflammatory form of fatty liver disease, found that 59% of patients on the highest dose achieved NASH resolution at 72 weeks, compared to 17% on placebo (Newsome et al., 2021). The liver before-and-after is invisible to the camera but potentially life-altering for people with progressive liver disease.
Sleep and Energy Before and After
Weight loss of 10% or more often improves sleep quality substantially. Obstructive sleep apnea, which affects roughly 40% of people with obesity, improves or resolves as neck circumference and pharyngeal fat decrease. Before treatment, a person might require a CPAP machine. After 6 to 12 months on semaglutide, some users can discontinue CPAP entirely.
Energy follows a characteristic pattern. The first 4 to 8 weeks often bring fatigue as the body adapts to lower caloric intake. By month 3 to 4, energy typically improves as excess weight drops, sleep quality increases, and blood sugar stabilizes. By month 6, most users report sustained energy levels that exceed their pre-treatment baseline. The before-and-after difference in daily functional capacity can be as significant as the visual transformation.
How to Track Your Own Before-and-After Progress
Tracking produces accountability and prevents the distorted perception that comes from daily mirror checks. A systematic tracking protocol captures changes that gradual daily observation misses.
Progress photos: Take front, side, and back photos on day one, then every four weeks. Same time of day, same lighting, same clothing (or no clothing). Store them in a dedicated phone album. Compare month 1 to month 3, not week to week. Weekly photo comparisons are too granular to show meaningful change.
Scale protocol: Weigh once per week, on the same morning, after urination, before eating. Record the number without reacting. Evaluate trends in 4-week blocks. A single reading is noise. A 4-week trend is signal. Daily weighing introduces anxiety without information.
Waist circumference: Measure at the navel with a flexible tape measure. Record monthly. This captures visceral fat loss, which semaglutide targets preferentially. A shrinking waist with a stable scale means fat is being replaced by denser muscle tissue. That is a favorable outcome even though the weight has not changed.
Bloodwork: Request a comprehensive metabolic panel and lipid panel at baseline, 12 weeks, and 6 months. Track fasting glucose, HbA1c, triglycerides, LDL, HDL, ALT, and CRP. These numbers quantify internal before-and-after changes that photos and scales miss.
Clothing benchmarks: Choose one pair of pants and one shirt at the start. Try them on monthly. The fit tells you about inches lost in specific locations, which neither the scale nor waist measurement fully captures. Use the semaglutide dosage calculator to ensure your dose is optimized throughout the tracking period.
Semaglutide vs. Tirzepatide: Comparing Before-and-After Results
For people evaluating GLP-1 medications, the head-to-head comparison between semaglutide and tirzepatide provides the most direct before-and-after contrast.
The SURMOUNT-5 trial directly compared tirzepatide (up to 15 mg) against semaglutide (2.4 mg) over 72 weeks. Tirzepatide produced 20.2% average weight loss versus 13.7% for semaglutide. The percentage of participants achieving 20% or more weight loss was 47% with tirzepatide versus 22% with semaglutide.
The before-and-after difference between the two drugs is approximately 6 to 7 percentage points of additional weight loss with tirzepatide. For a 220 lb person, that is roughly 14 additional pounds at the trial endpoint. The visual difference in before-and-after photos at that margin is noticeable but not dramatic.
Tirzepatide achieves greater weight loss through dual agonism: it activates both GLP-1 and GIP receptors, whereas semaglutide activates GLP-1 alone. For a detailed comparison, see our semaglutide to tirzepatide switching guide. For people already on tirzepatide who are not seeing expected results, our guide on why you are not losing weight on tirzepatide covers troubleshooting steps. And for sustaining results once you reach your target, see tirzepatide maintenance dose after weight loss.
Frequently Asked Questions
How much weight do most people lose on semaglutide?
The average weight loss in the STEP 1 trial was 14.9% of body weight at 68 weeks on the 2.4 mg dose. For a 220 lb person, that is approximately 33 pounds. However, 86% of participants lost at least 5%, while only 32% achieved the dramatic 20%+ losses that dominate social media before-and-after posts.
When do you start seeing visible results from semaglutide?
Most people notice visible changes in facial puffiness and waistline by week 8 to 12, when cumulative weight loss reaches 5 to 10% of starting weight. For a 220 lb person, that is 11 to 22 pounds. Before-and-after photos taken at 4-week intervals capture changes that daily mirror checks miss.
What does 3 months on semaglutide look like?
At 3 months (12 weeks), average weight loss reaches 8 to 10% of starting body weight. For someone starting at 220 lbs, that is 18 to 22 pounds. Visible changes include a leaner face, reduced waistline, and clothing fitting 1 to 2 sizes smaller. Blood pressure and triglycerides typically improve measurably by this point.
Do semaglutide results last after you stop taking it?
Participants who stopped semaglutide after 68 weeks regained approximately two-thirds of their weight loss within one year. Appetite returns within 2 to 3 weeks as the drug clears the system over 5 weeks. Maintaining exercise habits and dietary changes developed during treatment improves long-term weight retention.
Why are some people's semaglutide before-and-after results better than others?
Results range from less than 5% to over 30% weight loss depending on five key factors: starting weight, insulin resistance status, diet quality (especially protein at 0.7 to 1.0 g per pound of lean mass), exercise habits, and medication adherence. People with type 2 diabetes lose approximately 35% less weight than non-diabetic users.
Is semaglutide or tirzepatide better for before-and-after results?
Tirzepatide produces greater average weight loss: 20.2% versus 13.7% for semaglutide at 72 weeks in the SURMOUNT-5 head-to-head trial. Roughly 47% of tirzepatide users lost 20% or more of body weight, compared to 22% on semaglutide. Tirzepatide activates both GLP-1 and GIP receptors, while semaglutide targets GLP-1 alone.
What blood test results change on semaglutide?
After 6 to 12 months, typical improvements include fasting glucose down 10 to 15 mg/dL, HbA1c reduced by 0.5 to 1.0 percentage points, triglycerides down 15 to 25%, systolic blood pressure down 3 to 6 mmHg, CRP (inflammation) down 30 to 40%, and liver enzyme ALT normalization. These changes represent genuine cardiovascular risk reduction.
How long do I need to take semaglutide to see maximum results?
Maximum weight loss occurs between months 12 and 16, with the STEP 1 trial documenting 14.9% loss at 68 weeks. The 2-year STEP 5 trial showed only marginal additional loss at 15.2%. Treatment beyond 16 months maintains results rather than extending them. The dose escalation alone requires 16 to 20 weeks to complete.
The Bottom Line
Semaglutide before-and-after results follow a predictable clinical trajectory: 2 to 3% weight loss at month one, 5% at month two, 8 to 10% at month three, 10 to 12% at month six, and 14.9% at the 68-week STEP 1 trial endpoint. These numbers represent population averages across 1,961 participants, not social media highlights.
The most important before-and-after difference is often invisible in photos. Cardiovascular risk reduction, metabolic normalization, and liver fat clearance represent the deepest health benefits. A 20% reduction in major cardiac events, documented in the 17,604-participant SELECT trial, is a before-and-after comparison that matters more than any mirror selfie.
Use our semaglutide dosage calculator to verify your current dose during escalation. For managing side effects through the early months, see our guides on nausea, fatigue, and hair loss. If your results are not matching expectations, our troubleshooting guide covers the most common fixable causes. For reconstitution and storage, see how much bacteriostatic water for semaglutide, does semaglutide need to be refrigerated, and does semaglutide expire.
Related articles: - How Long Does Semaglutide Take to Work? -- week-by-week timeline with dose-escalation details - Not Losing Weight on Semaglutide -- five common causes and how to fix each one - Semaglutide to Tirzepatide Switching Guide -- when and how to transition between GLP-1 medications - Best Peptides for Weight Loss -- comparing semaglutide, tirzepatide, and emerging options - How Long Does Semaglutide Stay in Your System? -- pharmacokinetics of drug clearance after stopping - Semaglutide Dosage Chart (mL) -- complete dosing reference for all semaglutide formulations - How Long Do Semaglutide Side Effects Last? -- duration and management of common side effects - Getting Started with Peptides -- foundational guide for new peptide users
Helpful Tools
Related Articles
How Long Does Semaglutide Take to Work?
Semaglutide reduces appetite within days, produces measurable weight loss at 4-8 weeks, and delivers significant results by 12-16 weeks.
Can You Drink on Semaglutide? Risks
Can you drink on semaglutide? No ban, but risks include hypoglycemia, prolonged intoxication, 73% fat-burn suppression, and worse GI side effects.
How to Get Semaglutide: Prescription, Cost, Access
Get semaglutide via prescription, telehealth, or pharmacy. BMI eligibility, insurance, brand vs. compounded costs, and access guide for 2026.
How Much Is Semaglutide? 2026 Cost Breakdown
Semaglutide costs $149-$1,349/month depending on formulation. Compare Wegovy, Ozempic, compounded, and oral prices with savings strategies.